July 2012 Newsletter
In this Number:
Laptop or Tablet
Percentile
School Vocabulary
Definition of "Psicopedagogo"
Laptop or Tablet

If you're thinking of purchasing new electronic equipment but you can't decide whether you want a laptop or a tablet, here are some of the main pros and cons:
LAPTOP TABLET
not very portable due to size and weight very portable
not very discrete when open due to L-shape discrete
a lot of memory limited memory
has a disc drive to load software and watch DVDs no disc drive
smaller screen huge screen great for photo/video
keyboard lasts longer than touch screen touch screen great for selecting
more comfortable for typing should purchase a separate keybrd
for serious business great for gaming
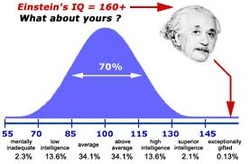
Percentile
You may have heard the term percentile in school or doctor’s offices because it is almost always used when considering statistics.
From Wikipedia:
In statistics, a percentile (or centile) is the value of a variable below which a certain percent of observations fall. For example, the 20th percentile is the value (or score) below which 20 percent of the observations may be found. The term percentile and the related term percentile rank are often used in the reporting of scores from norm-referenced tests.
There is no standard definition of percentile yet all definitions yield similar results when the number of observations is very large. Percentile tells us if our measurements or scores are average or not.
What percentile is used for
In statistics, a percentile (or centile) is the value of a variable below which a certain percent of observations fall.
The 25th percentile is also known as the first quartile (Q1), the 50th percentile as the median or second quartile (Q2), and the 75th percentile as the third quartile (Q3).
The Term Percentile as Used in Medicine
I researched the term and found this question posted by a very concerned dad:
Fetal weight under 50th percentile. What does it mean?
My wife and I will be having our first baby. I live away from my wife. Today she called me and informed me that the doctors told her, that fetus' weight is under 50th percentile, and the legs of the fetus were about 7 cm. What exactly does this mean? I am really worried. I am not sure what this means. Can anyone please shed their expert light on this topic and what I should be doing?
These were some of the answers:
Response 1: Being 'under' the 50th percentile means that your baby is pretty close to 'average' (technically: 'Statistical Median') weight.
Response 2: All that less than 50th percentile means is that she is bigger than less than half of the fetuses her age. Nothing to be concerned about. If she were in the 75th percentile, that means she's bigger than 75 out of those 100 fetuses. Perfectly normal either way.
Response 3: Well it means that your baby so far is smaller than average, without knowing how far along she is i cant be much more help than that im sorry.
Response 4: Small ish baby. 50th percentile = 50 babies out of 100 would be bigger, and 50 smaller.
Conclusion: Poor father! One cannot imagine how all this conflicting information made him feel. Not only do people not understand percentile, but doctors say things like “under the 50th percentile” How are they using the term “under”? Is this fetus “below” the average weight or is the fetus normal and under the label of average?
From Help Guide.org:
A child’s “BMI-for-age” shows how his or her BMI compares with kids of the same age. A child between the 85th and 95th percentile on the growth chart is considered at risk of overweight. A child at the 95th percentile or above is considered overweight.
Weight and height percentiles are determined by growth charts and body mass index charts to compare a child's measurements with those of other children in the same age group. By doing this, doctors try to track a child's growth over time and monitor how a child is growing in relation to other children. There are different charts for boys and girls because their growth rates and patterns differ. For both boys and girls there are two sets of charts: one for infants 0 to 36 months old and another for children 2 to 20 years old.
Creating a chart that reflects how many children have certain measurements and calculating percentiles is not the same thing. Percentiles measure deviation from the median or average measurements (or scores). Percentiles go up or down, away from the average.
Most doctors seem to interpret the Weight/Height Chart as follows: the 50% line is the median, the average. When the chart was created, of all the children measured, most of them had certain measurements and therefore these measurements are presented as the 50th percentile, median or average. When comparing a real child to the chart, if a child’s weight and height are within those of the 50th percentile, he is average; he is in the 50th percentile.From Johns Hopkins Children’s Center:
Failure to Thrive Children are diagnosed with failure to thrive when their weight or rate of weight gain is significantly below that of other children of similar age and gender. Infants or children that fail to thrive seem to be dramatically smaller or shorter than other children the same age. Teenagers may have short stature or appear to lack the usual changes that occur at puberty. However, there is a wide variation in what is considered normal growth and development. From Early Intervention Support.com:
Failure to thrive is a weight consistently below the 3rd to the 5th percentile for age, progressive decrease in weight to below the 3rd to the 5th percentile, or a decrease in the percentile rank of 2 major growth parameters in a short period.
Conclusion: Help Guide says that children with weight in the 75th percentile are too heavy and if in 95th percentile they are overweight. Early Intervention Support says that a baby is in the category of “failure to thrive” if it is in the 5th to 3rd percentile. Some mothers have reported through various blogs that their babies had consistently lost weight until the weight was so low that they “fell of the charts” Therefore one must assume that the lower the percentile, the lower the weight and the higher the percentile, the higher the child’s weight.
The Term Percentile As Used by Stock Brokers
Here the term “Top 10th Percentile” and “In the top 10%” are used to describe the same thing. According to the definition of percentile there is no such thing as the “Top X percentile.” Of course one can be in the top 10 or within the top 10 %. The first expression therefore seems to be used incorrectly. See article headline below:
From FORBES Online:
Top 10th Percentile Ranked Dividend Stock BGCP Becomes Oversold
DividendChannel.com Contributor
The Dividend Rank formula at Dividend Channel ranks a coverage universe of thousands of dividend stocks, according to a proprietary formula designed to identify those stocks that combine two important characteristics — strong fundamentals and a valuation that looks inexpensive. BGC Partners Class A (NASD: BGCP) presently has a stellar rank, in the top 10% of the coverage universe, which suggests it is among the top most “interesting” ideas that merit further research by investors.
Conclusion: And then, there are the terms ‘oversold,’ and ‘top most interesting.’ I won’t even go there.
The Term Percentile Used by Teachers
A percentile indicates the relative standing of a data value when data are sorted into numerical order, from smallest to largest. p% of data values are less than or equal to the pth percentile.
Low percentiles always correspond to lower data values. High percentiles always correspond to higher data values.
A percentile may or may not correspond to a value judgment about whether it is "good" or "bad". The interpretation of whether a certain percentile is good or bad depends on the context of the situation to which the data applies. In some situations, a low percentile would be considered "good'; in other contexts a high percentile might be considered "good". In many situations, there is no value judgment that applies.
Understanding how to properly interpret percentiles is important not only when describing data, but is also important in calculating probabilities.
From How to Calculate Percentiles by an eHow Contributor
(I tried this as did several of my colleagues and we obtained no successful results.)
When you take a test and get a score back 87%. It tells you how many questions you got right. But your test score doesn’t tell you how well you did compared to other people who took the test. Percentiles are values from 0 to 99 that tell you the percentage of tests with scores less than a particular score. If the percentile of your test score is 75, this means you scored higher than 75% of the people who took the test. Percentiles can be used to compare values in any set of data that is ordered. You can compute percentiles for income, weight, and many other things. There two calculations commonly used.
Things you'll need:
Data set of observations (in this guide, we will assume a set of 150 test scores)
Calculator
Computer spreadsheet or pencil and paper for sorting the data set
Instructions
1. Sort the test scores so they are in order from lowest to highest score. Normally this is done by entering the scores in a computer spread sheet and then clicking on the sort command. You can do this manually by listing the possible scores on the test in order and then making a hash mark beside the appropriate score for each test.
2. Start to calculate the percentile of your test score (as an example we’ll stick with your score of 87). The formula to use is L/N(100) = P where L is the number of tests with scores less than 87, N is the total number of test scores (here 150) and P is the percentile. Count up the total number of test scores that are less than 87. We’ll assume the number is 113. This gives us L = 113 and N = 150.
3. Divide out L/N to get the decimal equivalent. (113/150 = 0.753). Multiply this by 100 (0.753(100) = 75.3).
4. Discard the digits to the right of the decimal point. For 75.3 this leaves 75. This is the percentile of a score of 87 and means you did better than 75% of the people who took the test. Not bad at all!
5. Calculate the score which is at a given percentile. Let’s say you want to know what the median test score is (the test score for which 50% of the students scored less and 50% scored as much or higher. We use the same variables but a slightly different equation. The formula is P/100(N) = L. In our example, P = 50 and N = 150 so we have 50/100(150) = 75.
6. Count the number of test scores starting with the lowest until you get to 75. The next higher score (#76) is the score at the 50th percentile.
Conclusion: After implementing this formula and after reading very much and trying to understand what teachers mean when they say that a child is in the 90th percentile, I have come to the conclusion that I do not understand the term “percentile” and I will simply interpret it into Spanish as “percentil” which is the modern literal translation of the word, although this term has only been being used overseas in the last 5 to 7 years or so. If I am interpreting at a school during a parent-teacher conference or during a meeting to discuss a student’s individualized education plan and the teacher uses the term “percentile” I will leave it up to the parent to request an explanation of the term.
7/79/2012: After reading the PERCENTILE piece above several times, I remembered something from my Elementary School days. I wrote it down with the hope that it could maybe ease any anxiety about not understanding a term you translate. Of course, in our profession opinions don't matter and we interpret what we hear whether we agree with it or not, and in this case, whether we understand it or not. In cases where we need to research a term, sometimes it's good to know when to say 'enough' and when to keep digging.
Percentile; I don't remember teachers using the term percentile when I was a kid (although it was a long time ago, and I may have just forgotten.) After reading this paper though, I did remember that my elementary school report card had printed in large, bold letters on the back: Do not compare your child’s grades with the grades of his or her classmates. The term percentile, as it is explained above, means “how well you did compared to other people who took the test.” Now, with children of my own, I’m not sure that I am very interested in understanding this method of ranking students in comparison to others. I make my children study for exams and expect them to get good grades. Although I want to know how students of one school compare to students of other schools (especially if an institution is private and costly) I, as a parent want to be focused on how my child’s grades reflect his or her own efforts, performance during exams, success with certain methods of study, etc. If schools rank a student based on the average performance of its student body, in one school one child may be underestimated as an average student while he or she is in reality outstanding or a child may reflect as average in a certain school when in reality he or she is an underachiever. Of course, most parents already observe their child’s grades and try to understand the child’s performance in school and help them, but I don't think I’m interested in trying so hard to understand the method a teacher uses to calculate how a first grader ranked out of a group of maybe 1000 testers. What if 999 of those testers were sleepy, lazy, or not intelligent? I understand that the term percentile is used to allocate Federal funding and to determine school-ranking within a State. In the future, when comparing colleges, the term percentile will probably come in handy in understanding average grades of the college population, percentage of graduates that obtained work, their respective salaries, etc. For now, I think ‘percentile’ is a term teachers and administrators need to understand since it's their schools that are being graded.
8/10/2010: Percentile is like Greek Yogurt; everybody wants to use it, but nobody knows what it really is.
School Vocabulary
|
IEP- Individualized Educational Plan
Learning problems and disabilities Evaluation and neuropsychology treatment Current Performance Goals Regular Education The School System Early Childhood Education Assessment Assessment of disabilities |
Plan individual de estudios
Problemas de aprendizaje y discapacidades Evaluación y tratamiento neuropsicológico Desempeño actual Objetivos Educación Común El sistema educativo Educación temprana Evaluación Determinación de discapacidad |

|
PSICOPEDAGOGIA

A diferencia de un maestro que se concentra en enseñar material contenido en un plan de estudios, el psicopedagogo trabaja con alumnos con problemas de aprendizaje, enseñándoles estrategias que les permiten aprender el material en forma autónoma.
Diferencia existe entre un psicólogo y un psicopedagogo
El psicopedagogo no es un maestro especializado ni un psicólogo de niños. Es un profesional especializado en la forma en que las personas aprenden. Atiende a niños, adolescentes y adultos.
Existen psicopedagogos dedicados al aprendizaje y entrenamiento laboral (recursos humanos), otros orientados hacia la institución escolar y por último aquellos orientados al enfoque clínico. El psicopedagogo clínico busca prevenir, detectar y tratar problemas en el aprendizaje. Como profesional, cuenta con recursos y herramientas que le permiten establecer un diagnóstico de las dificultades y fortalezas. Ello lo hace a través de la evaluación de las distintas áreas involucradas en el aprendizaje. Para evaluar, utiliza pruebas estandarizados que le brindan información objetiva para poder entender al paciente. Además utiliza su experiencia y otros conocimientos para interpretar los resultados obtenidos y llegar a un diagnóstico. Luego de un diagnóstico especifico, es capaz de establecer un pronóstico y un plan de tratamiento.
El psicólogo es un profesional orientado hacia el conocimiento de la personalidad, manejo de las emociones y relaciones interpersonales. Atiende tanto a niños, adolescentes como adultos. Muchas veces los niños con problemas de aprendizaje también presentan dificultades a nivel emocional, de conducta o autoestima. Es frecuente que un niño realice ambos tratamientos en forma simultánea.
